Denis Bakin
Position Visualization for Imprecise Maps
Abstract
Geographic 2D maps are the most common tool simplifying navigation in an unknown terrain. The conventional geographic maps originally used for specific applications evolve dramatically addressing particular needs of those. The result of such evolution in many cases turned out to be imprecise map representing general topology and disposition of the landmarks but omitting unimportant details and distorting proportions in order to improve perception and simplify the visual search. This paper presents a technique for positioning data (e.g. obtained from GPS) visualization on imprecise artistic and/or schematic maps. The technique is based on the search for the most perceptually correct mapping position relative to an initial set of mapped locations.
Contents
Position Visualization Technique
The conventional geographic maps originally used for specific applications evolve dramatically addressing particular needs of those. The result of such evolution in many cases turned out to be imprecise map representing general topology, but omitting unimportant details and distorting proportions in order to improve perception and simplify the visual search. The first references to intentionally simplified maps are going back as far as the times of ancient Rome [5].
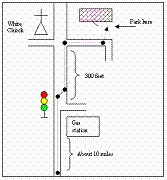
The figure 1 below shows examples of imprecise maps: a route description sketch; a portion of a custom made resort map; and a portion of a schematic strip map.
Figure 1. Examples of imprecise maps.
Although the imprecise maps are generally easier to handle, they still suffer from common for all maps usability problems. The most difficult task for a user of any map is to recognize and create mental binding of the real world locations to their abstract representations given by the map. The contemporary Global Positioning System (GPS) devices could be of a great help in solving this problem, but they are conventionally used with geographic maps only. A technique that provides perceptually correct visualization of the positioning data on imprecise maps would allow combining advantages of those with the convenience of the GPS use. Further development would allow augmentation of any (let say opened in a web browser) image with standardized set of global positioning data mappings, and whenever applicable show the location of the capable of the position reporting palm computer or cell phone device on the image displayed.
The technique allowing position visualization on imprecise maps should be capable of converting any real world (altitude and longitude) coordinates from a given area into correspondent coordinates on the imprecise map. The vast majority of the conventional geographic maps contain information for mapping the real world coordinates to the map positions. The latter allows us to consider the task of the technique being to perform mapping of a geographic map image presenting an area of interest into an imprecise map image representing the same area or a portion of it.
The figure 2 shows a geographic map of the area of interest. The mesh of the blue points covers the area within where we would like to map positions to the route sketch presented on figure 3.
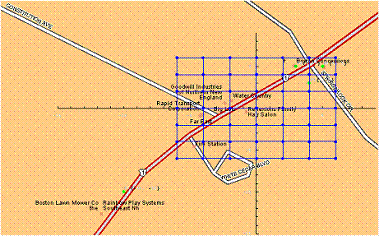
Figure 2. Geographic map of the area of interest.
The mapping is based on a set of binding points (predefined mapped positions). The binding points should generally be chosen by the person or software designing the imprecise map based on the design goals. For a route the binding points would include crossroads, landmarks and important route points. The example presented on the figures 2 and 3 limits the number of the binding points in order to simplify the case.
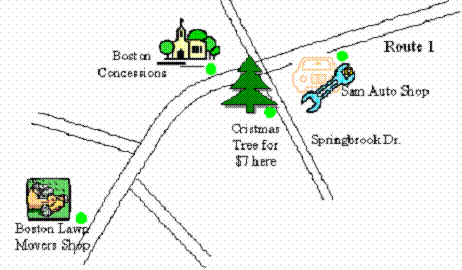
Figure 3. Route sketch.
Summarizing the above, for a given position on a geographic map the Position Visualization Technique should allow calculation of the correspondent position in the coordinates of the target imprecise map based on a predefined set of coordinates of important locations on the geographic map associated with the imprecise map coordinates of those locations. The position calculated should be perceptually the best match relative to the predefined set of the important location (binding points).
A quick evaluation of several approaches (listed below) to base the Position Visualization Technique on has been performed:
· Interpolation of the coordinate transformation functions x`=Fx(x,y) and y`=Fy(x,y), where Fx and Fy were 1st and 2nd degree polynomials derived using the best square fit approximation for matching to the set of the binding points.
· Averaging on positions each of which was calculated with regard to a unique pair of binding points, i.e. for each triangle formed of position (x,y) and any 2 binding points, a position (xn`,yn`) was calculated by scaling, rotating and moving the triangle to match the binding points vertices to their coordinates on the imprecise map, and the final (x`,y`) were determined by averaging all (xn`,yn`).
· Determining the imprecise map position by searching coordinates (x`,y`) minimizing an error function evaluating the difference between original geographic and the imprecise map.
The first two approaches turned out to be unable to produce acceptable output even in simple cases. The last approach showed the most stable and quite promising results but turned out to be computationally expensive and required a complex algorithm.
The algorithm implementing Position Visualization Technique involves two stages. The first stage is performed once during creation of the set of binding points. It involves the use of computationally expansive calculations to produce an additional set of points with their correspondent matching positions on the imprecise map (e.g. calculating imprecise map coordinates for the mesh of the blue points on the figure 2). The calculated data then attached to the imprecise map.
The second stage is to be implemented in the map viewer showing the map on a mobile device equipped with the position reporting software. The position reported is visualized on the imprecise map relative to the three closest known points found in the predefined and the additional (calculated during the first stage) point sets.
The second stage calculations are well known, straightforward and relatively inexpensive. They will not be further addressed in this document. The first stage calculations are the hart of the technique determining the quality of the mapping. The first stage calculations algorithm is described below.
Given real map coordinates of location P and pairs of points Pi, Pj, where both Pi and Pj are from the set predefined binding points and Pi, Pj are mapped to known PPi, PPj on the target imprecise map, generate error function having minimum at the best matching (with respect to PPi,PPj) position PP (figure 4).
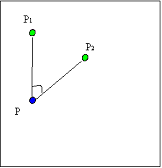
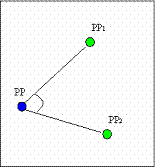
Figure 4. Error function generation.
The criteria for the best matching were determined by the most important for orientation factors: the relative direction and distance (i.e. the direction and distance from P to Pi with respect to Pj). The following formulas show how error would be calculated for two binding points case:
P = {x,y}; P1 = {x1,y1}; P2 = {x2,y2};
PP = {xx,yy}; PP1 = {xx1,yy1}; PP2 = {xx2,yy2};
The angle error function fa(xx,yy) is the sum of the square differences of the angles’ sins and cosines.
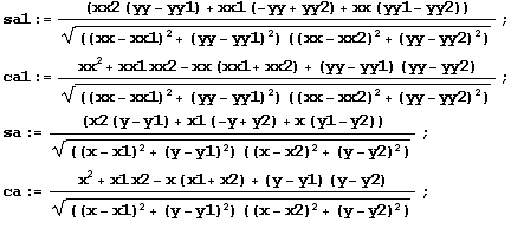
fa(xx,yy) = (ca-ca1)*(ca-ca1)+ (sa-sa1)*(sa-sa1) ;
The relative distance error function fd(xx, yy):
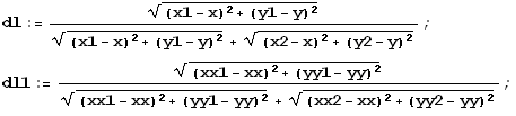
fd(xx, yy) = 2*(dl-dl1) *(dl-dl1) ;
The combined error function F1,2(xx,yy) is a sum of the angle and the distance error functions with empirically chosen adjustment coefficient k.
Fi,j(xx,yy) = fa(xx,yy) + k * fd(xx, yy) ;
A graph for the negated function F1,2j(xx,yy) with
x=7; y=7; x1=5; y1=-5; x2=-5; y2=-5;
xx1=5; yy1=5; xx1=-5; yy1=-5; k=4;
is presented on figure 4.
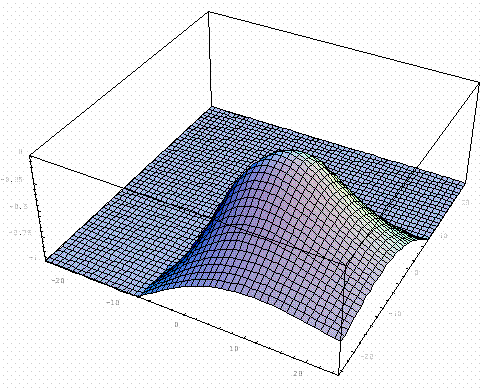
Figure 4. Graph of the negated error function for two binding points.
The error function Fsum(xx,yy) for more then two binding points is calculated as the sum of all Fi,j(xx,yy) for all i and j, where i!=j.
The function Fsum(xx,yy) is differentiable, so the gradient methods for minimum search (e.g. Newton method) are applicable and can be used to find the best matching PP(xx,yy).
The iterative search methods results are dependent on the search start position when the function searched has multiple local minimums, therefore consistent mechanism for selecting the start point is important. For a well formed set of binding points preserving the plane continuity, finding the search start position by calculating transformed triangle for the position being mapped and two closest binding points (i.e. the triangle based approach mentioned in the previous chapter) is assumed to be a good enough approximation.
The application of the proposed algorithm to the case presented on the figures 2 and 3 yielded results showed on the figure 5. The predefined binding points set was
{-10,-10} => {91,299-242};
{5,5} => {383,299-63};
{4,3} => {302,299-125};
{3, 5} => {236,299-76};
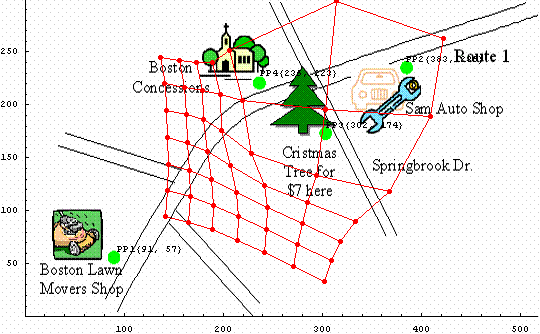
Figure 5. Transformed Mesh of Points.
Following several examples show properties of the algorithm by applying it to a small sets of binding points possessing particular features. Similarly to the previous examples, the green dots show the binding points, blue dots show a mesh of positions to be mapped to imprecise map and the red dots the mapped to the imprecise map positions.
The example presented on figures 6 and 7 demonstrate how the algorithm handles relatively high rate rescaling of a map region.
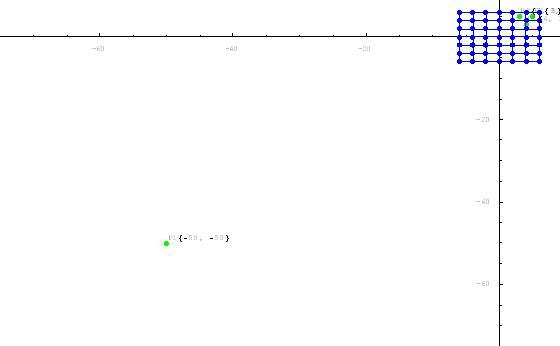
Figure 6. High rate rescaling original map data.
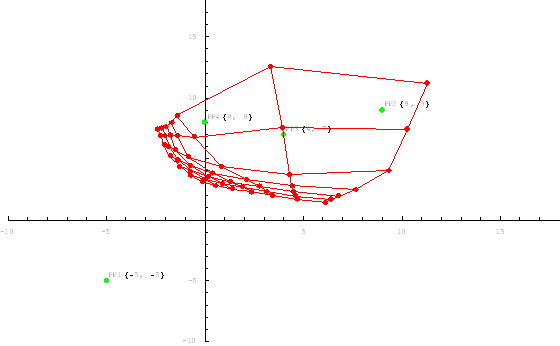
Figure 7. High rate rescaling transformed map data.
The example presented on figures 8 and 9 shows the multiple region rescaling.
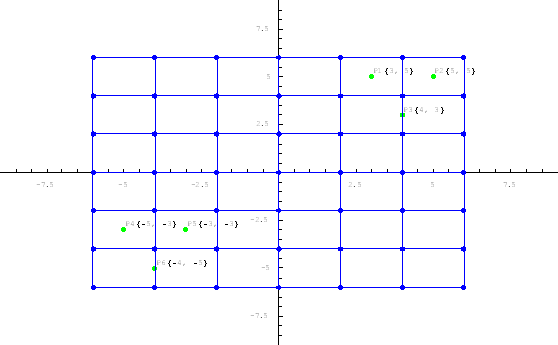
Figure 8. Multiple region rescaling original map data.
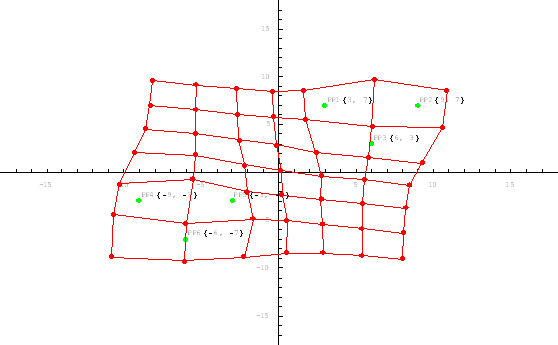
Figure 9. Multiple region rescaling transformed map data.
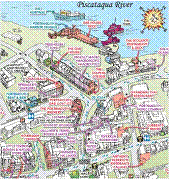
The example presented on figures 10 and 11 shows transformation of a portion of Delorme street atlas map to the correspondent portion of artistic map of Portsmouth downtown created by resotmaps.com. Note that the map data is not well formed. There is an inconsistency in the crossroads marked by points 7 and 14 (mid-right).
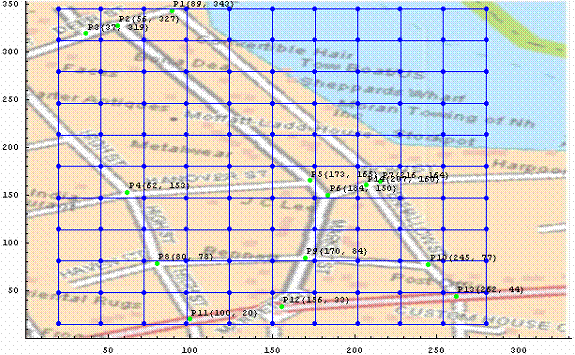
Figure 10. Portsmouth downtown Delorme map.
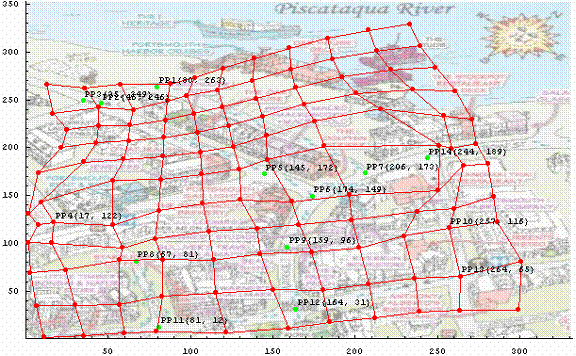
Figure 11. Portsmouth downtown artistic map.
The position visualization for an imprecise map is relatively simple given that the data for real world coordinate mapping to the imprecise map space densily cover the area reflected by the map. The first stage algorithm presented can help in creation of this level of area coverage based on a relatively small initial set of binding points defining mappings for important in the context of the imprecise map locations. The choice of the binding points, though, is a human driven process that might require several interactions to produce the best result. Also, the algorithm is quite computationally expensive.
It would worth mentioning that the proposed first stage algorithm might be applicable elsewhere. For example, it would be interesting to investigate the possibility of using it for automatic generation of driving directions in the form of continuous route sketches (like the one presented on the figure 3), vs. the most popular currently turn-by-turn maps or verbal instructions sometimes combined with a scaled down view of the whole route.
1. Christian Kray, Christian Elting, Katri Laakso,Volker Coors, “Route Instructions on Mobile Devices”, Proceedings of the 8th international conference on Intelligent user interfaces, 2003.
2. Riku Suomela, Kimmo Roimela, Juha Lehikoinen, “The evolution of perspective view in WalkMap”, ACM, 2003.
3. Arei Kobayashi, Satoru Takagi, and Naomi Inoue, “Extensions of SVG for Human Navigation by Cellular Phone”, ACM, 2003
4. Hernan Casakin,Thomas Barkowsky, Alexander Klippel and Christian Freksa, “Schematic Maps as Wayfinding Aids”, Spatial Cognition II - Integrating Abstract Theories, Empirical Studies, Formal Methods, and Practical Applications, pp. 54–71. Springer, Berlin.
5. Daniel Elroi, “GIS and Schematic Maps: A New Symbiotic Relationship”.
6. Mac Eachren A.M., “The Evolution, Application and Implications of Strip Format Travel Maps”, Cartographic Journal, 24: 147-158, 1987.